How can businesses lower carbon emissions through lighting? In 2026, the answer extends beyond replacing old bulbs with LEDs. The U.S. Department of Energy reports that LED products can use at least 75% less energy than incandescent lighting. They can also last up to 25 times longer. That difference is visible in a warehouse aisle, where fewer replacements mean fewer deliveries, discarded lamps, and maintenance hours.
The International Energy Agency identifies energy efficiency as a critical tool for reducing energy demand and emissions. IEA Executive Director Fatih Birol has called efficiency “the first fuel.” His point matters for commercial lighting. Efficient fixtures, occupancy sensors, daylight controls, and connected systems can reduce wasted electricity in offices, stores, factories, and hotels. A meeting room should not remain fully lit for an empty afternoon.
However, LEDs are not a magic wand. Poorly designed upgrades can create glare, excessive brightness, and unnecessary material waste. Businesses should measure existing energy use, operating hours, lighting levels, and control performance before purchasing equipment. The Carbon Trust also recommends prioritising energy efficiency and measuring reductions against a clear baseline. This approach supports credible carbon reporting.
The best solution may not be the newest product. It may be better control.
This 2026 guide examines practical lighting strategies, lifecycle impacts, and measurable savings. It also questions a common assumption: lower electricity consumption does not automatically mean the lowest total carbon footprint. Manufacturing, transport, repairability, and responsible disposal deserve attention too.
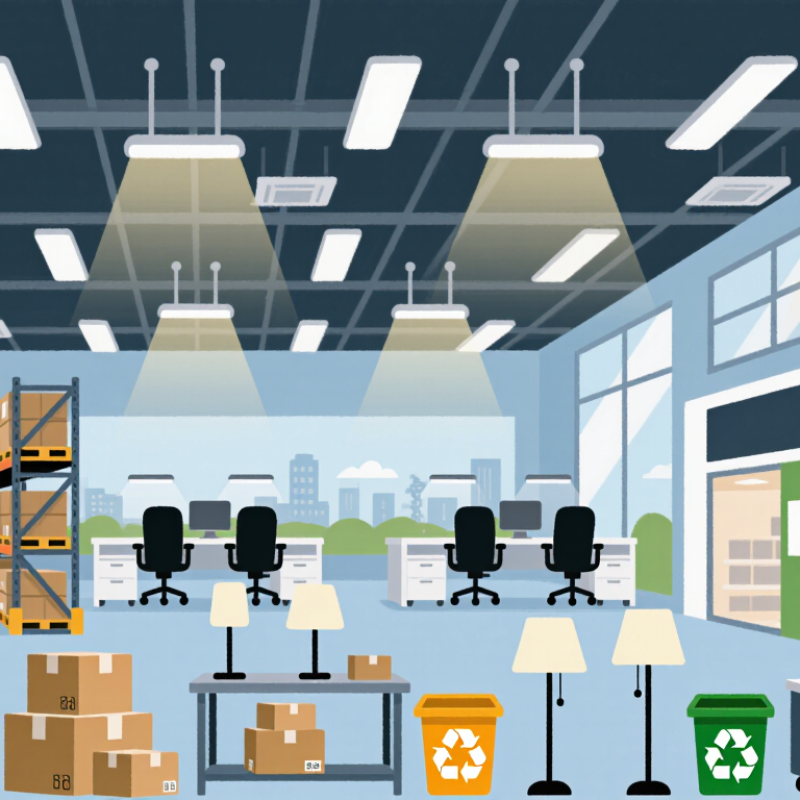
A low-carbon lighting solution in 2026 must perform beyond the fixture itself. Energy efficiency still matters, but it is only one part of the calculation. A well-designed system combines efficient light sources, accurate optics, daylight sensing, and occupancy controls. These features reduce wasted electricity in empty rooms and overlit corridors. In practice, a warehouse can benefit from lights that dim near skylights and brighten only when workers arrive.
That matters.
Carbon assessment should include manufacturing, transport, installation, maintenance, and disposal. A fixture with slightly lower energy use may create more emissions if it is difficult to repair or replace. Longer service life helps, especially when components such as drivers, lenses, and control modules are replaceable.
Reliable suppliers should provide performance data, product declarations, warranty terms, and test results. Marketing claims are not enough.
Measure it.
Human experience also defines a credible low-carbon solution. Excessive dimming can create unsafe work areas, while harsh glare may reduce comfort and productivity. Lighting levels should match the task, room layout, and user needs.
Commissioning is essential because poorly configured sensors often remain inactive. I have seen efficient systems waste power through incorrect schedules and permanent maximum output.
That weakness deserves attention.
A practical design reviews energy data after installation, checks occupant feedback, and adjusts settings when real conditions differ from the original plan. Even the best specification can fail without careful operation.
Reducing lighting carbon emissions starts with measuring actual energy use, not guessing from fixture counts. A practical audit records each lamp’s wattage, quantity, operating hours, and control settings. The basic calculation is simple: watts × hours ÷ 1,000 equals kilowatt-hours. However, assumptions can distort the result. A hallway may remain lit overnight, while an office may use daylight controls inconsistently.
Measure, then verify. Compare calculated consumption with electricity bills or temporary meter readings. For carbon emissions, multiply lighting kilowatt-hours by the current grid emission factor for the project’s location. Use a documented factor from a reliable government, utility, or recognized reporting source.
Keep operational and embodied carbon separate. Replacing equipment may reduce electricity use, but discarded materials and manufacturing also matter. A quick spreadsheet is useful. It is not perfect.
Tips: Inspect rooms at different times, including early morning and late evening. Check whether occupancy sensors switch lights off completely. Record seasonal changes and maintenance issues. Use qualified professionals when circuits, controls, or emergency lighting require technical review. Set a baseline before upgrades, then compare monthly energy and carbon results. Small errors matter. Lighting assessments should be repeated, because schedules, tenants, and control habits change.
2026 Best Lighting Solutions to Lower Carbon Emissions?
Which Technologies Deliver the Greatest Carbon Reductions
The largest carbon reductions usually come from efficient LED lighting paired with intelligent controls. Replacing older fluorescent fixtures can reduce electricity use substantially, but savings depend on operating hours and existing equipment. A warehouse running lights all night offers more reduction potential than a small office using daylight effectively. Measure the load.
Occupancy sensors switch lights off in empty rooms, while daylight controls reduce output near windows. Networked systems can adjust lighting by zone, schedule, and task requirements. In practical retrofits, these controls often deliver greater savings than efficiency improvements alone. However, poor calibration can cause complaints, unnecessary brightness, or disabled sensors. Technology does not replace commissioning.
Design also matters. Task lighting can illuminate a workbench without brightening the entire room. Longer-lasting components reduce maintenance visits, transport emissions, and replacement waste. Yet embodied carbon remains easy to overlook. A new fixture may use less electricity but still carry manufacturing and installation impacts. Request product life-cycle data, installation records, and verified energy measurements before claiming major reductions.
A reliable project begins with a baseline: fixture count, wattage, operating schedule, and measured electricity use. Compare results after installation across similar seasons. My experience is that simple systems often perform better when staff understand them. Some projected savings will be wrong. Review them honestly.
Which technologies deliver the greatest operational carbon reductions?
Planning ranges synthesized from public guidance on LED efficiency and lighting controls by the U.S. Department of Energy. Carbon reductions are estimated from electricity savings under the same grid-emission factor. LED Basics · Lighting Controls
2026 Best Lighting Solutions to Lower Carbon Emissions?
How to Design and Implement a Low-Carbon Lighting System
Designing a low-carbon lighting system starts with the building, not the fixture. During site reviews, I record window orientation, ceiling height, task locations, and hours of use. A warehouse aisle needs different light from a reading room. Simple errors become permanent energy costs. Use daylight before adding output. Interior layouts should place desks near available daylight, while glare control protects comfort. Select efficient LED luminaires with suitable optics, long service lives, and replaceable components. Efficiency alone is not enough. Manufacturing, transport, maintenance, and disposal also affect whole-life emissions.
Model the space with target illuminance, uniformity, glare, and lighting power density. Verify calculations against applicable energy codes and lighting standards. Avoid over-lighting empty corners. Presence sensors can dim or switch zones when occupancy changes. Daylight sensors should respond gradually, or users may disable them. In one practical setup, corridor lights remain at a low background level and rise when movement is detected. The control sequence needs commissioning, not assumptions. Test it after sunset, during cloudy weather, and during the busiest shift. Record kilowatt-hours, operating hours, complaints, and failed sensors.
Implementation works best when electricians, facility staff, and occupants review the design together. Train staff to adjust schedules without defeating safety settings. Clean lenses and check sensors during planned maintenance visits because dust and misalignment reduce performance. Reuse existing wiring where safe, but do not force old infrastructure into an unsuitable control system. I have seen impressive simulations fail because nobody owned the settings after handover. That weakness deserves attention. Set a baseline, compare monthly results, and revise carefully. A low-carbon system should save energy while keeping faces clear, tasks accurate, and people comfortable.
Lighting upgrades can cut electricity use, but claimed carbon savings need a defensible measurement plan. Begin with a baseline. Record fixture wattage, operating hours, occupancy, daylight levels, and monthly electricity consumption for at least four representative weeks. Photographs and meter readings add useful evidence. Do not rely on fixture labels alone. Actual loads may differ because drivers, controls, and cleaning conditions affect performance.
After installation, measure the same spaces under similar schedules and occupancy patterns. In occupied buildings, I have found that real use rarely matches the design brief. Use a power meter to sample each lighting circuit, then compare kilowatt-hours with the baseline. Where possible, install temporary submeters for continuous data. Calculate savings by subtracting post-upgrade consumption from adjusted baseline consumption. Multiply verified kilowatt-hour savings by the applicable electricity emissions factor. Keep location and reporting-year factors documented. Grid intensity changes, so one carbon figure can become outdated.
Performance is more than lower energy use. Check maintained illuminance at desks, glare, switching response, and user complaints. A light meter can reveal dark corners that utility bills cannot. Track failed sensors, overridden controls, and after-hours operation for several months. These details often explain why projected savings are not achieved. Be transparent about uncertainty. If occupancy data is incomplete, report a range rather than invented precision. Early measurements are rarely perfect, and that limitation deserves attention.
| Solution or Metric | Typical Technical Range | Measurement Method | Annual Energy Impact | Estimated Emissions Impact | Recommended 2026 Performance Target |
|---|---|---|---|---|---|
| Existing fluorescent lighting baseline | 80–100 W per fixture, including lamp and ballast losses | Measure fixture input power with a calibrated power meter; record operating hours | Approximately 320–400 kWh per fixture per year at 4,000 operating hours | At a 0.40 kg CO2e/kWh grid factor: approximately 128–160 kg CO2e per fixture per year | Use verified measured power and operating hours rather than nameplate ratings |
| High-efficiency LED replacement | 25–45 W per fixture; approximately 100–180 lm/W system efficacy | Measure delivered illuminance in lux, input power in watts, and maintained light output | Approximately 100–180 kWh per fixture per year at 4,000 operating hours | Approximately 40–72 kg CO2e per fixture per year at a 0.40 kg CO2e/kWh factor | Achieve at least 30% lower input power than the verified baseline while maintaining required lux levels |
| Occupancy and vacancy sensing | Typical additional lighting-energy reduction: 20–50%, depending on occupancy patterns | Compare logged runtime before and after installation under similar occupancy conditions | Can reduce LED lighting energy by approximately 20–50% in intermittently occupied areas | For a 140 kWh LED load, approximately 11–28 kg CO2e saved per fixture per year at a 0.40 kg CO2e/kWh factor | Use vacancy shut-off in regularly unoccupied rooms and verify sensor time-outs |
| Daylight harvesting and dimming | Typical additional lighting-energy reduction: 10–40% where useful daylight is available | Log dimming levels, daylight sensor readings, and lighting energy consumption | Can reduce electric lighting energy by approximately 10–40% in perimeter zones | For a 140 kWh LED load, approximately 6–22 kg CO2e saved per fixture per year at a 0.40 kg CO2e/kWh factor | Maintain the required task illuminance while avoiding unnecessary full-output operation |
| Scheduling and automatic shut-off | Typical additional lighting-energy reduction: 5–20% | Compare programmed schedules with actual occupancy and after-hours runtime logs | Can reduce annual runtime by approximately 200–800 hours in suitable facilities | For a 40 W fixture, approximately 3–13 kg CO2e saved per fixture per year at a 0.40 kg CO2e/kWh factor | Eliminate avoidable after-hours operation without compromising safety or security requirements |
| Lighting quality and visual performance | Typical maintained illuminance: 300–500 lux for many office tasks; project requirements may differ | Measure average and minimum lux, uniformity, glare risk, colour rendering, and flicker | Energy savings should not be accepted if they cause under-lighting, excessive glare, or reduced productivity | Indirect emissions benefit comes from reducing over-lighting while preserving required visual conditions | Meet the applicable project standard and verify results after installation at task level |
| Lighting controls connectivity | Digital monitoring can provide circuit-level or zone-level runtime and energy data | Use submeters, control-system logs, or interval data from a building management system | Enables continuous identification of abnormal runtime, failed controls, and unnecessary energy use | Improves the reliability of calculated CO2e savings by replacing estimates with measured data | Collect monthly energy, runtime, occupancy, and fault data for each major lighting zone |
| Lighting power density | Expressed as W/m2; target values depend on building type, layout, and local code | Divide connected lighting load by the conditioned or illuminated floor area | Lower W/m2 generally indicates lower installed lighting demand, provided illuminance is adequate | Annual emissions = lighting power density × floor area × operating hours × grid emissions factor | Set a project-specific W/m2 target after completing a lighting and occupancy assessment |
| Life-cycle carbon assessment | Includes operational energy, replacement materials, manufacturing, transport, and end-of-life | Use product environmental data, service life, replacement intervals, and measured energy consumption | Operational energy is often the dominant factor over the service life of efficient lighting systems | Report operational and embodied emissions separately before presenting total life-cycle savings | Prioritize durable, repairable, recyclable systems and avoid premature replacement of functional equipment |
| Renewable electricity interaction | Emissions savings depend on the electricity supply used by the facility | Apply location-based and, where required, market-based electricity emissions factors | Lower electricity consumption reduces demand regardless of the electricity procurement method | Use the applicable factor for the reporting boundary and disclose the factor, year, and source | Report energy reduction in kWh separately from location-based and market-based CO2e savings |
Record each fixture’s wattage, quantity, operating hours, and control settings. Use this formula: watts × hours ÷ 1,000 = kilowatt-hours. Then compare the estimate with electricity bills or temporary meter readings. Estimates can be wrong.
A hallway may stay illuminated overnight, while an office may use daylight controls inconsistently. Inspect rooms early in the morning and late in the evening. Small timing errors matter.
Multiply verified lighting kilowatt-hours by the applicable grid emissions factor. Document the factor, location, and reporting year. Grid intensity changes, so old figures can become outdated.
Efficient lighting combined with occupancy and daylight controls often performs best. Sensors can switch off empty rooms, while daylight controls reduce output near windows. Good calibration matters.
Yes. Poor calibration may cause glare, dark areas, complaints, or disabled sensors. Check switching response and user feedback for several months. Technology needs commissioning.
Create a baseline using fixture counts, wattage, schedules, occupancy, daylight levels, and monthly consumption. Photographs and meter readings provide useful evidence. Do not trust labels alone.
Measure the same spaces under similar schedules and occupancy conditions. Use a power meter or temporary submeters to compare actual kilowatt-hours. Adjust the baseline when usage patterns change.
Measure desk-level illumination, glare, dark corners, sensor failures, overrides, and after-hours operation. A utility bill cannot reveal poor visual performance. User complaints are evidence too.
Yes. Lower electricity use reduces operational carbon, but manufacturing, transport, installation, and disposal also matter. Request life-cycle information and installation records. The spreadsheet is useful, not perfect.
Report a reasonable range when occupancy or operating data is incomplete. Avoid invented precision. Early measurements are rarely perfect, and projected savings may need honest revision.
In 2026, low-carbon lighting is defined by more than efficient fixtures. It combines reduced energy consumption, longer service life, responsible materials, smart controls, and designs that provide the right amount of light for each space. This summary explains how businesses can evaluate lighting energy use and carbon emissions by reviewing operating hours, power demand, maintenance needs, electricity sources, and the full life cycle of equipment. It also considers how can businesses lower carbon emissions through lighting by replacing inefficient systems, improving daylight use, applying occupancy and daylight sensors, and using adaptive controls.
The article further explores how to design and implement a practical low-carbon lighting system through careful planning, zoning, installation, commissioning, and staff engagement. Finally, it outlines ways to measure performance and emissions savings with energy meters, lighting audits, maintenance records, and carbon calculations. By comparing baseline data with post-upgrade results, organizations can verify efficiency gains, reduce operating costs, and create more sustainable, comfortable, and resilient buildings.

Bluu Light